
Observability After Dashboards
Observability is becoming the control plane between software intent and production action—built on open signals, governed data, and bounded AI.
What comes after visibility
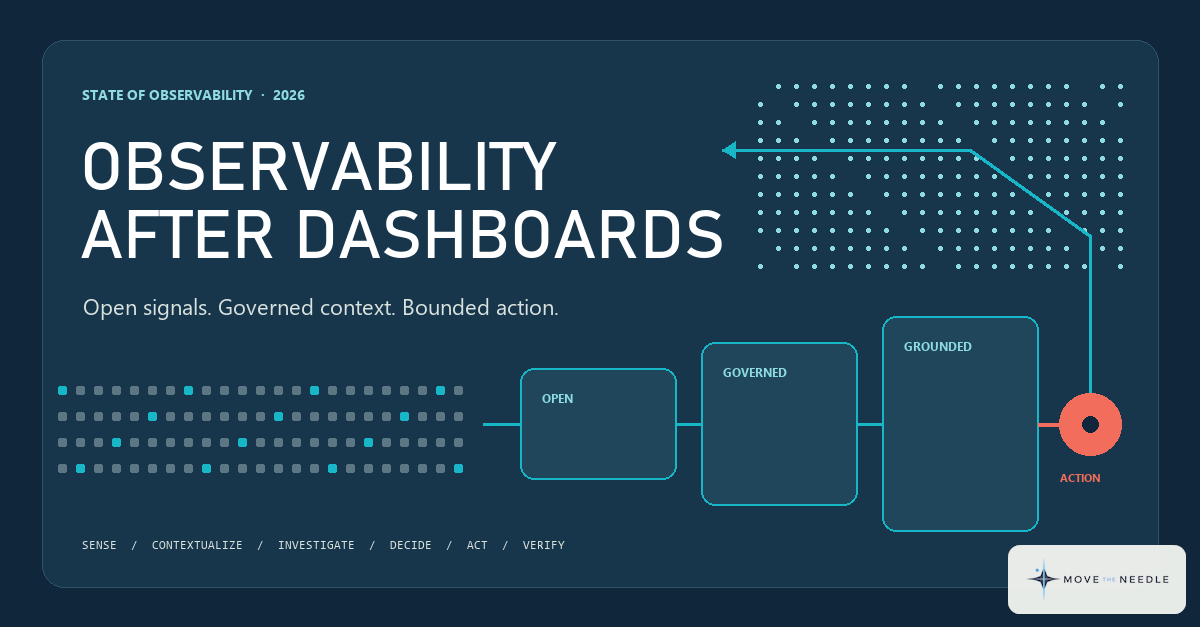
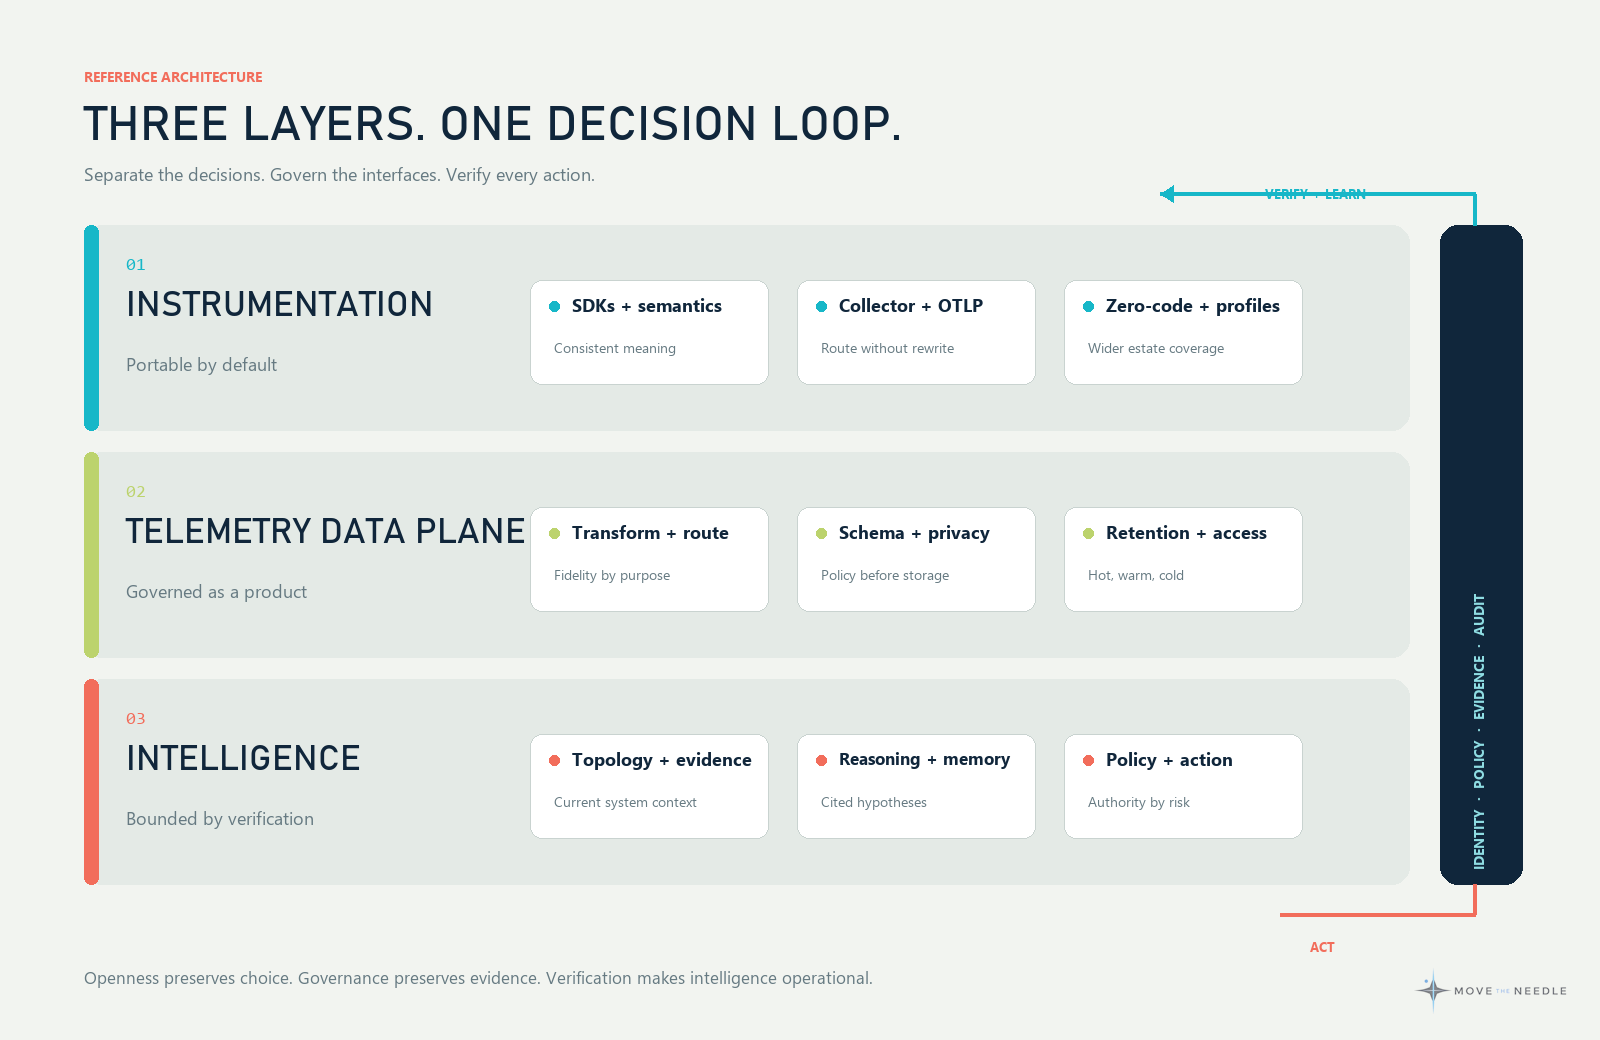
Observability is becoming the control plane between software intent and production action. The architecture that can support this shift has three distinct layers: open instrumentation, a governed telemetry data plane, and evidence-grounded intelligence with bounded authority to act.
Dashboards still matter. They are simply no longer the strategic centre of the decision.
The market is moving in three directions at once:
- Telemetry is being designed for machines as well as people.
- Data collection, transformation, storage, and access are becoming first-class platform decisions.
- Vendors are competing to move from explaining incidents to investigating, recommending, and eventually executing a response.
This does not mean autonomous SRE has arrived as a dependable operating model. Most of the strongest capabilities remain uneven, bounded, or in preview. It does mean that buying observability as a collection of dashboards and alerting features is becoming an increasingly weak way to frame the decision.
Production is outrunning human investigation
The previous operating model assumed a human would receive an alert, open several dashboards, form hypotheses, run queries, inspect recent changes, find the likely cause, choose a runbook, and decide whether to act. Observability helped the engineer see the system; the engineer supplied context, judgment, and authority.
The emerging model divides that work differently. An agent can gather evidence across telemetry, code, topology, deployment history, tickets, runbooks, and previous incidents before the engineer joins. It can maintain several hypotheses, test them, explain what it found, propose a response, and, within a narrow policy boundary, execute it.
The shift is visible across the market. Datadog is expanding Bits from investigation into detection and remediation, Dynatrace combines deterministic context with agentic reasoning, New Relic separates a managed SRE agent from agent-optimized access to its data substrate, and Cisco/Splunk is building an intelligence layer across security, network, and observability data (Datadog, 2026; Dynatrace, 2026; New Relic, 2026; Splunk, 2026a).
The common pattern matters more than the product names:
sense → contextualize → investigate → decide → act → verify
“The more advanced a control system is, so the more crucial may be the contribution of the human operator.”
— Lisanne Bainbridge, 1983
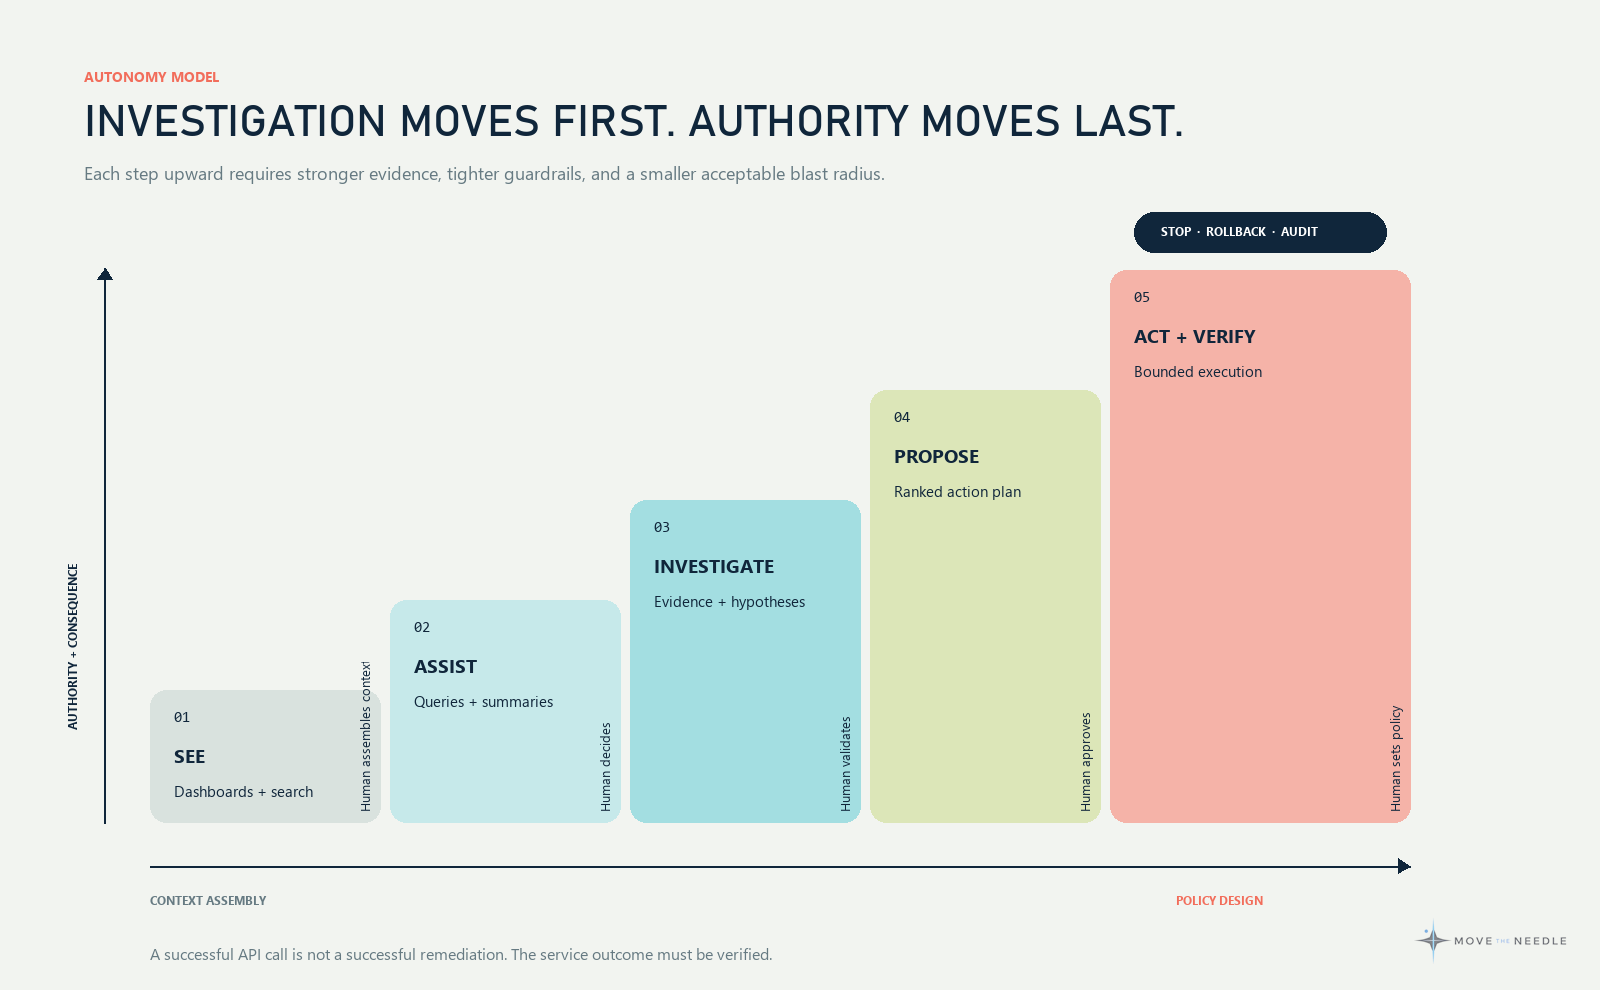
The transition will not be a clean move from human to machine. Investigation will automate faster than remediation because the risk is asymmetric: a poor diagnosis wastes time, while a poor action can widen the incident. Human responsibility therefore moves upward rather than disappearing. Engineers define policy, service criticality, evidence thresholds, blast-radius limits, exception paths, and the conditions under which an automated action must stop.
This is a different role. The scarce skill becomes less about remembering where a dashboard lives and more about designing a reliable decision system around production.
Reflection point: If an agent completed the first 15 minutes of an incident before a person joined, what evidence would the responder need to trust its conclusion?
Agentic SRE is an irreversible direction
Irreversible does not mean that every agentic product will survive, or that production systems will soon run without people. It means the operating model has crossed a boundary that is difficult to uncross: telemetry now has a machine consumer, and that consumer is moving from retrieval towards investigation and action.
The reason is structural. Production estates are becoming more dynamic, code is changing faster, and the evidence needed for an incident is spread across too many systems for a person to assemble repeatedly under pressure. Once an agent can do that initial assembly in seconds, asking every responder to return to manual correlation becomes difficult to justify. The durable change is not “AI replaces SRE.” It is that the first pass through operational evidence becomes machine-led, while people increasingly design the rules, review the reasoning, and decide how much authority to delegate.
Wild Moose is a useful signal of this transition. It presents itself as an always-on AI first responder that brings together logs, metrics, code, changes, and company-specific debugging practices to produce evidence-backed root-cause summaries and recommended actions. It coordinates specialised agents, but its integrations remain read-only (Wild Moose, 2026). That boundary is revealing. The credible near-term product is not an unconstrained digital operator. It is a fast, contextual investigator that earns the right to be trusted before it earns the right to act.
This is why Agentic SRE can be irreversible while full autonomy remains uncertain. Products will change. Some vendors will disappear. Many pilots will fail. Yet the expectations placed on telemetry, operational knowledge, interfaces, policy, and auditability will not return to their dashboard-era form.
Reflection point: Which is the stronger signal of maturity: an agent that can execute more actions, or one that knows when the evidence is not sufficient to act?
Gartner: right direction, wrong unit of analysis
Gartner predicts that by 2028, agents will make at least 15% of day-to-day work decisions and appear in 33% of enterprise applications. It also expects more than 40% of agentic projects to be cancelled by the end of 2027. Its 2026 Hype Cycle adds the right caveat: ambition is running ahead of governance, context, and cost control (Gartner, 2025; Gartner, 2026).
I agree with the direction—and with the likely failures. In observability, agents are becoming both a new consumer of telemetry and a participant in incident response.
But “autonomous decisions” is the wrong unit. Incident response is a chain: gather evidence, test, recommend, authorise, execute, verify. The meaningful measure is which steps an agent controls, on what evidence, with what blast radius and stop conditions—not the number of decisions it makes.
Cancelled projects will not necessarily reverse the trend. Their useful capabilities may simply become normal platform features.
Reflection point: If agentic projects fail but observability becomes agent-readable, did the trend fail—or become infrastructure?
Three layers now matter
The observability platform should no longer be treated as one indivisible tool choice. It is more useful to separate three architectural layers because each creates a different form of control, cost, and dependency.
1. Instrumentation: open is the entry condition
Instrumentation is the part of the architecture embedded most deeply in applications, runtimes, hosts, pipelines, and delivery practices. It is also the part with the longest replacement tail. A proprietary decision here can outlive several backend contracts.
OpenTelemetry reached CNCF Graduated status in May 2026. Its importance is not that every signal and semantic convention is finished; they are not. Its importance is that vendor-neutral instrumentation, collection, and export are now a credible enterprise default rather than an experimental side path. Stable declarative configuration, a vendor-neutral Collector, improving Prometheus interoperability, zero-code options, and the emerging Profiles signal keep widening the practical boundary (OpenTelemetry Community, 2026a, 2026b, 2026c, 2026d; Prometheus Team, 2024).
My position is direct: if a platform cannot participate cleanly in an OpenTelemetry-based instrumentation strategy, it should not be on the strategic shortlist.
That test needs precision. Accepting OTLP at an endpoint is not the same as being open. The decision should cover:
- whether applications can use upstream SDKs and semantic conventions;
- whether collectors, routing, and sampling remain portable;
- whether the vendor requires proprietary agents for material capabilities;
- whether telemetry can be sent to more than one destination;
- whether switching the analytical backend requires reinstrumenting applications.
Open instrumentation does not make the entire platform portable. Dashboards, queries, alert logic, derived data, service models, access policies, and retained history may still be proprietary. OpenTelemetry is the exit hatch at the application boundary, not a guarantee that the whole house can move.
Reflection point: If the analytical backend changed next year, which parts of the observability system would survive without application changes?
2. The data layer: telemetry becomes a governed product
“Because information flow is both influential and also indicative of other aspects of culture...”
— Ron Westrum, 2004
Once collection is open, the next constraint is no longer simply storage. It is the ability to preserve useful context at a sustainable cost while enforcing quality, privacy, residency, and retention policy.
This is why the telemetry pipeline has moved from plumbing to architecture. The OpenTelemetry Collector can receive, process, filter, transform, and export signals. OTTL is becoming more capable at schema normalization, redaction, attribute governance, and selective filtering. Commercial pipeline products such as Cribl extend this control across mixed estates and destinations; Coralogix makes customer-owned object storage part of its platform architecture. Datadog has also introduced BYOC Logs, while Cisco/Splunk and Snowflake/Observe are positioning federated and data-cloud approaches as alternatives to putting every byte into one premium hot tier (OpenTelemetry, 2026e; Cribl, 2026; Coralogix, n.d.; Datadog, 2025/2026; Snowflake, 2026).
The architectural question is no longer “How much telemetry can we ingest?” It is “Which data deserves which fidelity, latency, retention, and access path?”
A mature data plane should be able to:
- collect once and route deliberately;
- normalize semantics before they fragment downstream;
- enrich signals with ownership, service, business, and change context;
- remove or mask sensitive fields before storage;
- preserve full-fidelity data where investigation or compliance requires it;
- place hot, warm, and cold data according to access need;
- expose data to humans, analytical engines, and agents through governed interfaces;
- measure the cost and value of telemetry by producer and consumer.
Cost pressure is real, but cost is often a symptom of an absent decision model. Grafana Labs' 2026 survey found complexity and overhead were the leading concern, ahead of cost, while cost remained the most important selection criterion. The same survey found strong support for open standards and centralized observability (Grafana Labs, 2026a). The message is not that centralization always wins. It is that fragmentation, duplicated collection, uncontrolled cardinality, and unclear ownership create both operational and economic waste.
The data layer is where observability becomes an operating model. Someone must own schemas, service identity, collection policy, sampling, routing, retention, access, and chargeback. Without that ownership, an intelligence layer will reason over inconsistent or incomplete evidence, only faster.
Reflection point: Which telemetry is retained because it has known operational value, and which is retained because nobody owns the decision to reduce it?
3. Intelligence: dashboards are the baseline
Dashboards, search, alerting, and correlation are expected capabilities. The new differentiation is whether a platform can create a defensible chain from signal to action.
That chain needs more than a language model attached to a query API. It needs:
- a current model of services, dependencies, owners, and changes;
- evidence retrieval across signals and operational knowledge;
- the ability to distinguish correlation from a plausible causal mechanism;
- memory that can be corrected and governed;
- confidence or uncertainty made visible to the operator;
- policy-aware action planning;
- explicit authority and blast-radius boundaries;
- post-action verification and a reliable stop condition;
- evaluation against realistic operational tasks.
Vendors are approaching this layer from different starting points. Dynatrace emphasises deterministic causal context beneath agentic reasoning. Datadog builds agents on a broad integrated telemetry surface. New Relic explicitly describes “headless” operations in which agents consume curated insight through APIs rather than navigate dashboards. Grafana has open-sourced an observability benchmark for agents, while Honeycomb reorganises agent investigation around the conversation and its tool calls rather than forcing a long-running workflow into one trace waterfall (Dynatrace, 2026; Datadog, 2026; New Relic, 2026; Grafana Labs, 2026b; Honeycomb, 2026a).
Specialists such as Resolve AI, Traversal, and Wild Moose start above the existing tool estate. Their thesis is that an agent should investigate across code, infrastructure, telemetry, and operational knowledge, learn company-specific debugging practice, or reason against a continuously updated production model rather than require a replacement of every underlying observability system (Resolve AI, 2026; Traversal, 2026; Wild Moose, 2026).
These are promising directions, not proof that autonomous operations are solved. The distinction between a persuasive explanation and a reliable diagnosis remains critical. So does the distinction between recommending an action and accepting accountability for its consequences.
The first-wave leaders face an architectural reset
The consolidated leaders of observability's first wave now face an architectural reset, not another feature cycle. Much of that wave was optimised for proprietary collection, centralised ingestion, premium storage, dashboard-led workflows, and human investigation. The new domain starts elsewhere: open instrumentation, programmable telemetry flows, mixed storage, machine-readable context, and agents inside the response loop.
Their installed base, data footprint, and customer trust are real advantages. The same estate becomes a liability when product architecture and commercial economics remain tied to ingestion volume, seats, and established interfaces. An assistant layered over the existing stack may improve the interface; it does not recreate the platform.
To lead the next wave, incumbents must be willing to cannibalise parts of the first one—technically and commercially. Without that reset, breadth becomes weight.
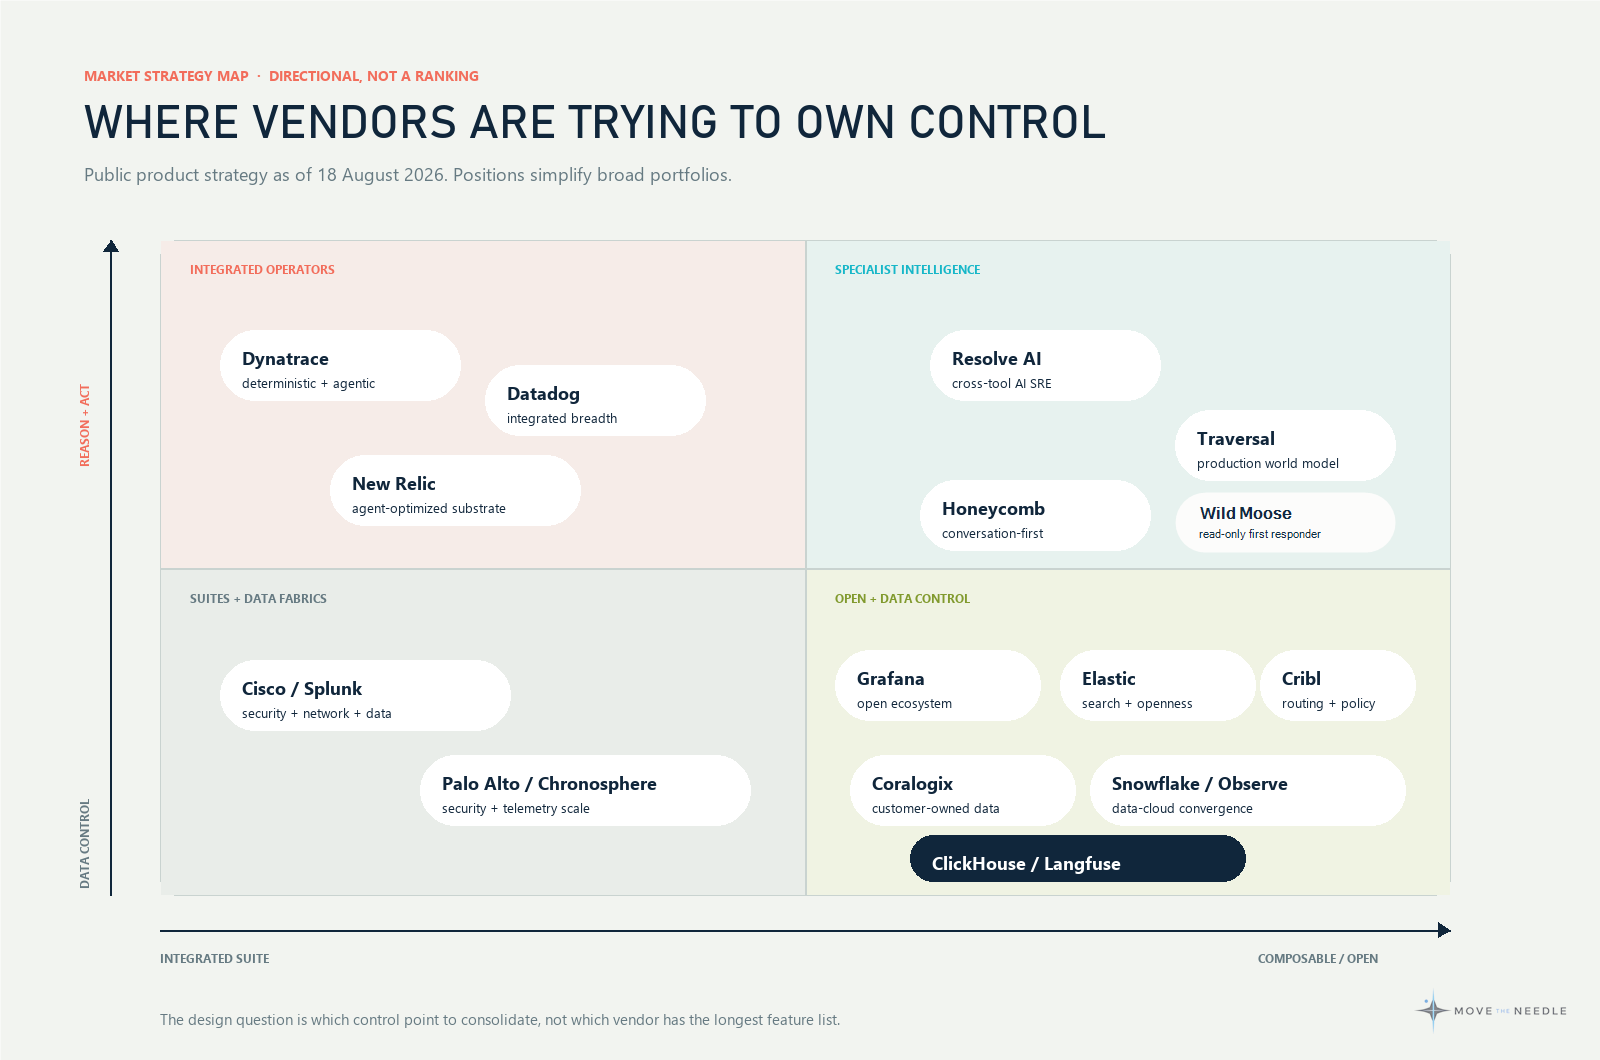
This is the backdrop for five vendor strategies now emerging. They are easier to understand when grouped by the control point each vendor is trying to own. This is a strategy map, not a product ranking.
| Strategic approach | Representative examples | Where it anchors | Main advantage | Main tradeoff |
|---|---|---|---|---|
| Integrated operations suite | Datadog, Dynatrace, New Relic | Broad telemetry, topology, workflows, and agentic action | Faster integration and a richer native context model | Commercial and architectural dependency concentrates in one platform |
| Security and network convergence | Cisco/Splunk, Palo Alto Networks/Chronosphere | Cross-domain data, security operations, network, and remediation | Wider operational context and fewer domain handoffs | Observability may become subordinate to a larger suite strategy |
| Open and composable ecosystem | Grafana, Elastic, Honeycomb | Open signals, flexible backends, high-cardinality exploration | Portability and the ability to assemble fit-for-purpose components | More integration, product ownership, and operational responsibility stays with the enterprise |
| Data-platform convergence | Snowflake/Observe, ClickHouse/Langfuse | Lakehouse or analytical engine as the observability substrate | Scale, retention economics, and reuse of enterprise data infrastructure | Operational workflows may be less mature than specialist observability suites |
| Specialist control layers | Cribl, Coralogix, Resolve AI, Traversal, Wild Moose | Telemetry routing/ownership or agentic reasoning above existing tools | Preserves optionality and attacks a specific structural constraint | Introduces another seam whose reliability, security, and support must be owned |
The large vendors are trying to make breadth compound. More signals create more context; more context improves investigation; more workflow integrations increase the actions the platform can take. Their strongest argument is not a longer feature list but lower context-assembly cost.
The specialists are making a different bet: the decisive control point will sit at a seam. It may be the telemetry pipeline, customer-owned storage, agent evaluation, causal production model, or governed execution layer. Their strongest argument is optionality and focus.
Consolidation supports both readings. Palo Alto Networks completed its acquisition of Chronosphere, Snowflake moved to acquire Observe, and ClickHouse acquired Langfuse. Security platforms want operational telemetry, data platforms want observability workloads, and analytical engines want the high-volume agent data that comes with them (Palo Alto Networks, 2026; Snowflake, 2026; ClickHouse, 2026).
The practical consequence is that selecting a vendor and selecting an architecture are no longer the same decision. An enterprise can rationally buy an integrated platform while preserving open instrumentation and an independent data policy. It can also compose specialist layers, but only if it is willing to operate the seams.
Reflection point: Which control point are you comfortable allowing one supplier to own: instrumentation, telemetry history, operational knowledge, or the authority to act?
The long tail is becoming mainstream
Capabilities that once sat at the edge of observability are moving toward the centre. I would watch six areas.
Continuous profiling and eBPF
Profiles provide code-level evidence about CPU, memory, and waiting time that metrics and sampled traces cannot always explain. OpenTelemetry Profiles entered public alpha in March 2026, with cross-signal correlation and an eBPF profiling agent integrated into the Collector ecosystem. Alpha status matters: this is a direction to prepare for, not yet a universal production standard (OpenTelemetry Community, 2026d).
eBPF and compile-time or zero-code instrumentation also reduce the dependency on application teams for basic coverage. They will not replace intentional semantic instrumentation, but they can close estate-wide blind spots and speed migrations.
Agent trajectories, conversations, and evaluations
An AI system can return HTTP 200 while failing the task. Reliability therefore expands from latency and errors into tool selection, loops, handoffs, token and model use, groundedness, safety, and outcome quality. Honeycomb's Agent Timeline and Grafana's AI Observability illustrate the move toward conversation- and trajectory-level signals linked to the underlying application and infrastructure (Honeycomb, 2026a; Grafana Labs, 2026c).
Production knowledge and causal models
Runbooks and post-incident reviews are useful but frequently stale and disconnected from live topology. Agentic SRE vendors are trying to turn operational knowledge, dependency relationships, baselines, and previous investigations into machine-readable context. The important question is not whether a vendor calls this a graph, world model, or memory. It is how the model stays current, how corrections are governed, and how conclusions cite evidence.
Telemetry policy at the edge
Filtering, redaction, enrichment, and routing increasingly happen before data reaches an analytical backend. This moves privacy, data quality, and cost control upstream. It also creates a new critical service: if the pipeline fails or silently changes meaning, every dashboard and agent downstream can become confidently wrong.
Sovereign and customer-controlled deployment
Customer-owned object storage, BYOC, private cloud, and in-cluster reasoning are moving from niche requirements to mainstream decision criteria, particularly where retention, residency, security, and exit economics matter. The architectural test is not the location of a vendor's control plane alone; it is which raw data, derived context, prompts, credentials, and operational actions cross the boundary.
Agent evaluation and action verification
Observability agents need the equivalent of production-grade test harnesses. Grafana's o11y-bench is one early example of evaluating agents on realistic querying and incident tasks. The more consequential capability is post-action verification: an agent should not consider a remediation successful because an API returned success. It should confirm the intended service condition improved and that no defined guardrail was breached.
These areas will not mature at the same speed. Profiles and pipeline governance extend known engineering practices. Agent evaluation, causal reasoning, and autonomous remediation still have larger evidence gaps. The right response is neither dismissal nor a broad production rollout, but staged adoption with explicit learning goals.
A better decision sequence
Feature comparisons tend to mix foundational and reversible choices. A more durable sequence is:
1. Fix the instrumentation boundary
Standardise on OpenTelemetry where technically credible. Define semantic conventions, ownership attributes, service identity, sampling principles, and the conditions under which proprietary instrumentation is allowed.
2. Design the data plane
Decide collection topology, routing, transformation, sensitive-data policy, storage tiers, retention, access paths, and cost accountability before selecting intelligence features that depend on them.
3. Choose where context will live
Determine which platform maintains topology, operational knowledge, change history, and cross-domain relationships. If several systems do, make the source of truth and synchronization rules explicit.
4. Introduce intelligence by authority level
Begin with read-only investigation and evidence quality. Move to recommendations, then approval-based execution, then narrowly bounded automation on low-criticality services. Each step needs entry criteria, evaluation data, rollback, audit, and a stop condition.
5. Test the exit path
Measure what it would take to move instrumentation, recent data, historical data, alerts, dashboards, service models, operational knowledge, and agent workflows. Contractual data ownership is not enough if practical export is slow, partial, or uneconomic.
This sequence does not imply a best-of-breed answer. Integration has real value. It simply prevents convenience at one layer from silently deciding every other layer for the next five years.
What I would not conclude yet
I would not conclude that dashboards are obsolete. Humans still need shared views for sense-making, communication, review, and learning. The change is that dashboards become one interface among several, not the architecture itself.
I would not conclude that a larger data set automatically produces better operational intelligence. Inconsistent semantics, missing ownership, stale topology, and low-quality runbooks can make more telemetry a larger source of ambiguity.
I would not conclude that deterministic methods and generative agents are competing philosophies. The credible designs combine them: deterministic policy, identity, topology, and verification around probabilistic reasoning.
I would not conclude that the newest specialist is necessarily the right strategic supplier. Many long-tail capabilities will be acquired, copied, standardized, or absorbed into larger platforms. The important work is to identify the capability and interface the enterprise needs, not predict which logo survives.
And I would not conclude that full autonomy is the destination for every service. Criticality, reversibility, regulatory obligation, and organizational risk appetite will produce different autonomy ceilings across the same estate.
The architecture is the strategy
Observability is becoming more consequential because it sits at the junction of software, data, operational knowledge, and action. As code generation accelerates and production systems become less legible to any one person, the ability to create trusted operational context becomes part of the engineering system itself.
The direction is reasonably clear even if the end state is not.
Open instrumentation preserves choice. A governed data plane preserves useful evidence at sustainable cost. An intelligence layer turns that evidence into decisions, but only governance and verification make action trustworthy.
The vendor market will continue to consolidate around those control points. Some enterprises will prefer the integration of a broad suite; others will compose an architecture from specialists. Both can work. The weak position is to let instrumentation lock-in, uncontrolled telemetry economics, or an attractive agent demo make the decision by default.
The question is no longer whether an observability platform can show what happened.
It is which parts of the production decision loop the enterprise is prepared to delegate, and which parts it must continue to own.
Selected references
- Bainbridge, L. (1983). Ironies of automation. Automatica, 19(6), 775–779. https://gwern.net/doc/sociology/technology/1983-bainbridge.pdf
- ClickHouse. (2026, January 16). ClickHouse welcomes Langfuse: The future of open-source LLM observability. https://clickhouse.com/blog/clickhouse-acquires-langfuse-open-source-llm-observability
- Coralogix. (n.d.). The cross-stack observability platform. https://coralogix.com/platform/
- Cribl. (2026, July 13). What is an observability pipeline? https://cribl.io/blog/the-observability-pipeline/
- Datadog. (2025, October 31; updated 2026, April 29). Store and search logs at petabyte scale in your own infrastructure with Datadog BYOC Logs. https://www.datadoghq.com/blog/introducing-datadog-byoc-logs/
- Datadog. (2026, June 9). DASH 2026: Guide to Datadog's newest announcements. https://www.datadoghq.com/blog/dash-2026-new-feature-roundup-keynote/
- Dynatrace. (2026, January 28). Dynatrace Perform 2026 ignites a new era of autonomous intelligence and innovation. https://www.dynatrace.com/news/press-release/perform-2026-ignites-new-era/
- Grafana Labs. (2026a, March 18). Grafana Labs' 4th annual Observability Survey reveals a field at a crossroads. https://grafana.com/press/2026/03/18/grafana-labs-4th-annual-observability-survey-reveals-a-field-at-a-crossroads-ai-economics-complexity-and-the-enduring-power-of-open-source/
- Grafana Labs. (2026b, April 21). GrafanaCON 2026 announcements. https://grafana.com/blog/grafanacon-2026-announcements/
- Grafana Labs. (2026c, April 21). AI Observability in Grafana Cloud. https://grafana.com/blog/ai-observability-for-agents-in-grafana-cloud/
- Gartner. (2025, June 25). Gartner predicts over 40% of agentic AI projects will be canceled by end of 2027. https://www.gartner.com/en/newsroom/press-releases/2025-06-25-gartner-predicts-over-40-percent-of-agentic-ai-projects-will-be-canceled-by-end-of-2027
- Gartner. (2026, April 15). What the 2026 Hype Cycle for Agentic AI reveals. https://www.gartner.com/en/articles/hype-cycle-for-agentic-ai
- Honeycomb. (2026a, June 18). Agent Timeline is now generally available. https://www.honeycomb.io/blog/agent-timeline-generally-available
- Honeycomb. (2026b, May 12). Honeycomb launches Agent Observability. https://www.honeycomb.io/blog/honeycomb-launches-agent-observability-full-visibility-agentic-workflows
- New Relic. (2026, June 23). New Relic Autopilot and New Relic Ground Truth capabilities supercharge agentic AI-first businesses. https://newrelic.com/press-release/20260623-2
- OpenTelemetry. (2026e, July 22). Lambda-powered functions land in OTTL. https://opentelemetry.io/blog/2026/lambda-powered-function-land-in-ottl/
- OpenTelemetry Community. (2026a, May 21). OpenTelemetry is a CNCF Graduated Project. https://opentelemetry.io/blog/2026/otel-graduates/
- OpenTelemetry Community. (2026b, March 5). Declarative configuration is stable. https://opentelemetry.io/blog/2026/stable-declarative-config/
- OpenTelemetry Community. (2026c). OpenTelemetry Collector. https://opentelemetry.io/docs/collector/
- OpenTelemetry Community. (2026d, March 26). OpenTelemetry Profiles enters public alpha. https://opentelemetry.io/blog/2026/profiles-alpha/
- Palo Alto Networks. (2026, January 29). Palo Alto Networks completes Chronosphere acquisition, unifying observability and security for the AI era. https://www.paloaltonetworks.com/company/press/2026/palo-alto-networks-completes-chronosphere-acquisition--unifying-observability-and-security-for-the-ai-era
- Prometheus Team. (2024, November 14). Announcing Prometheus 3.0. https://prometheus.io/blog/2024/11/14/prometheus-3-0/
- Resolve AI. (2026, July 17). Introducing AI for prod. https://resolve.ai/blog/introducing-AI-for-prod
- Snowflake. (2026, January 8). Snowflake announces intent to acquire Observe to deliver AI-powered observability. https://www.snowflake.com/en/blog/observe-ai-powered-observability/
- Splunk. (2026a, June 2). Accelerating the agentic enterprise: New Splunk platform innovations at Cisco Live Las Vegas 2026. https://www.splunk.com/en_us/blog/platform/new-splunk-platform-innovations-cisco-live-2026.html
- Splunk. (2026b, February 10). Splunk Observability update: Deeper insights for AI agents and digital experiences. https://www.splunk.com/en_us/blog/observability/splunk-observability-ai-agent-monitoring-innovations.html
- Traversal. (2026, March). Introducing Production World Model: An AI-readable model of your entire production environment. https://www.traversal.com/blog/introducing-production-world-model-ai-readable-model-your-entire-production-environment
- Wild Moose. (2026). The AI SRE for dynamic environments. https://www.wildmoose.ai/
- Westrum, R. (2004). A typology of organisational cultures. Quality & Safety in Health Care, 13(Suppl II), ii22–ii27. https://qualitysafety.bmj.com/content/13/suppl_2/ii22.short